Vermijd de piek!
Are you taking part in the Vermijd de piek! (Avoid the peak!) project of Energie van Utrecht and the energy cooperatives in the province of Utrecht? Then your dossier has the Vermijd de piek! analysis. It shows how much electricity you use during the evening peak, between 16:00 and 21:00, and how well you manage to shift your consumption to quieter moments.

Open the analysis
On the website:
- Open your dossier.
- In the menu, go to Analytics > Analyses.
- Click Vermijd de piek!.
In the app:
- Open your dossier.
- On the dashboard, tap Analyses.
- Tap Vermijd de piek!.
What do you need?
- A dossier linked to Energie van Utrecht or to a participating energy cooperative. This happens automatically when you sign up through the project page (in Dutch).
- A smart meter linked through Datadienst Slimme Meter (P4). The analysis uses the quarter-hour values of the electricity you take from the grid.
- An electricity grid connection in your dossier. It is normally created automatically.
After you link your smart meter, it takes about a day before the first data appears. Do you see the message that there is no quarter-hour data yet? Choose another period or come back later.
Choose the period and grid connection
Choose the period at the top right. The project runs from November to February: during those months the analysis opens on This winter. Outside them you first see the last 30 days. You can also choose Last winter, a month or your own period.
If you have more than one electricity grid connection, choose the one you want to see at the top left.
The parts of the analysis
Evening peaks
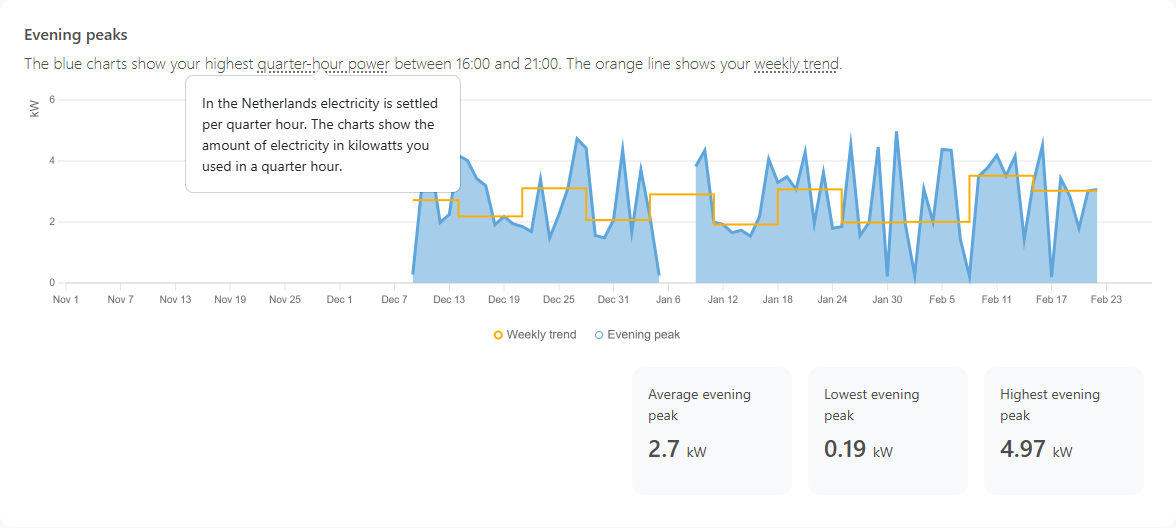
The blue chart shows your highest quarter-hour power between 16:00 and 21:00 for each day, in kilowatts. In the Netherlands electricity is settled per quarter hour: the quarter-hour power is the amount of electricity you use in a quarter hour. The orange line is your weekly trend: the median of your evening peaks per week. Below the chart you see your average, lowest and highest evening peak in the selected period.
Terms with a dotted underline explain themselves: hover over them with your mouse, or tap them in the app.
Peak share
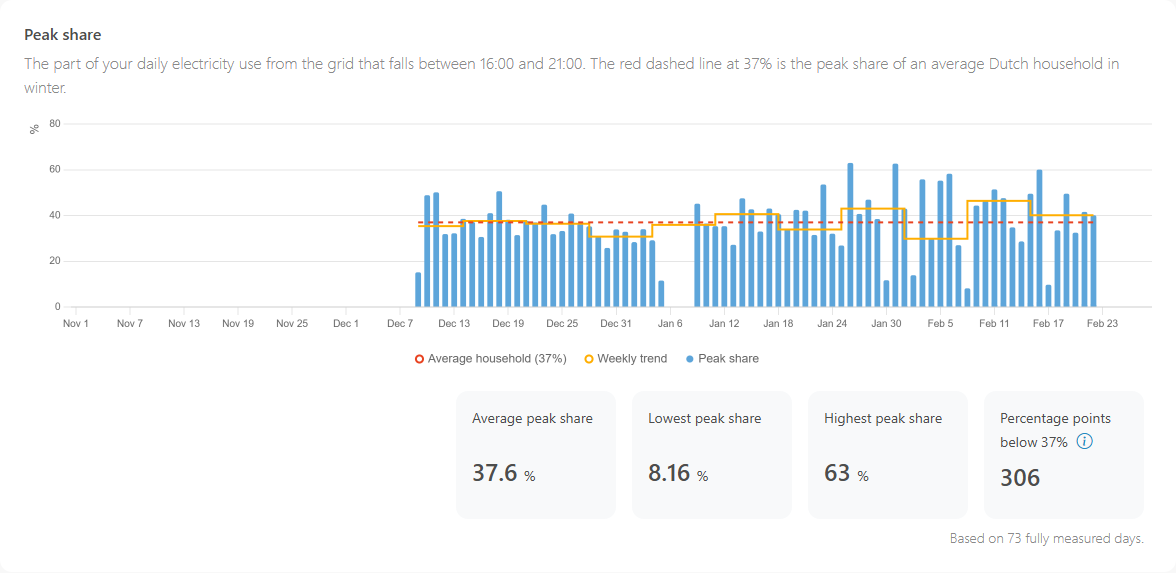
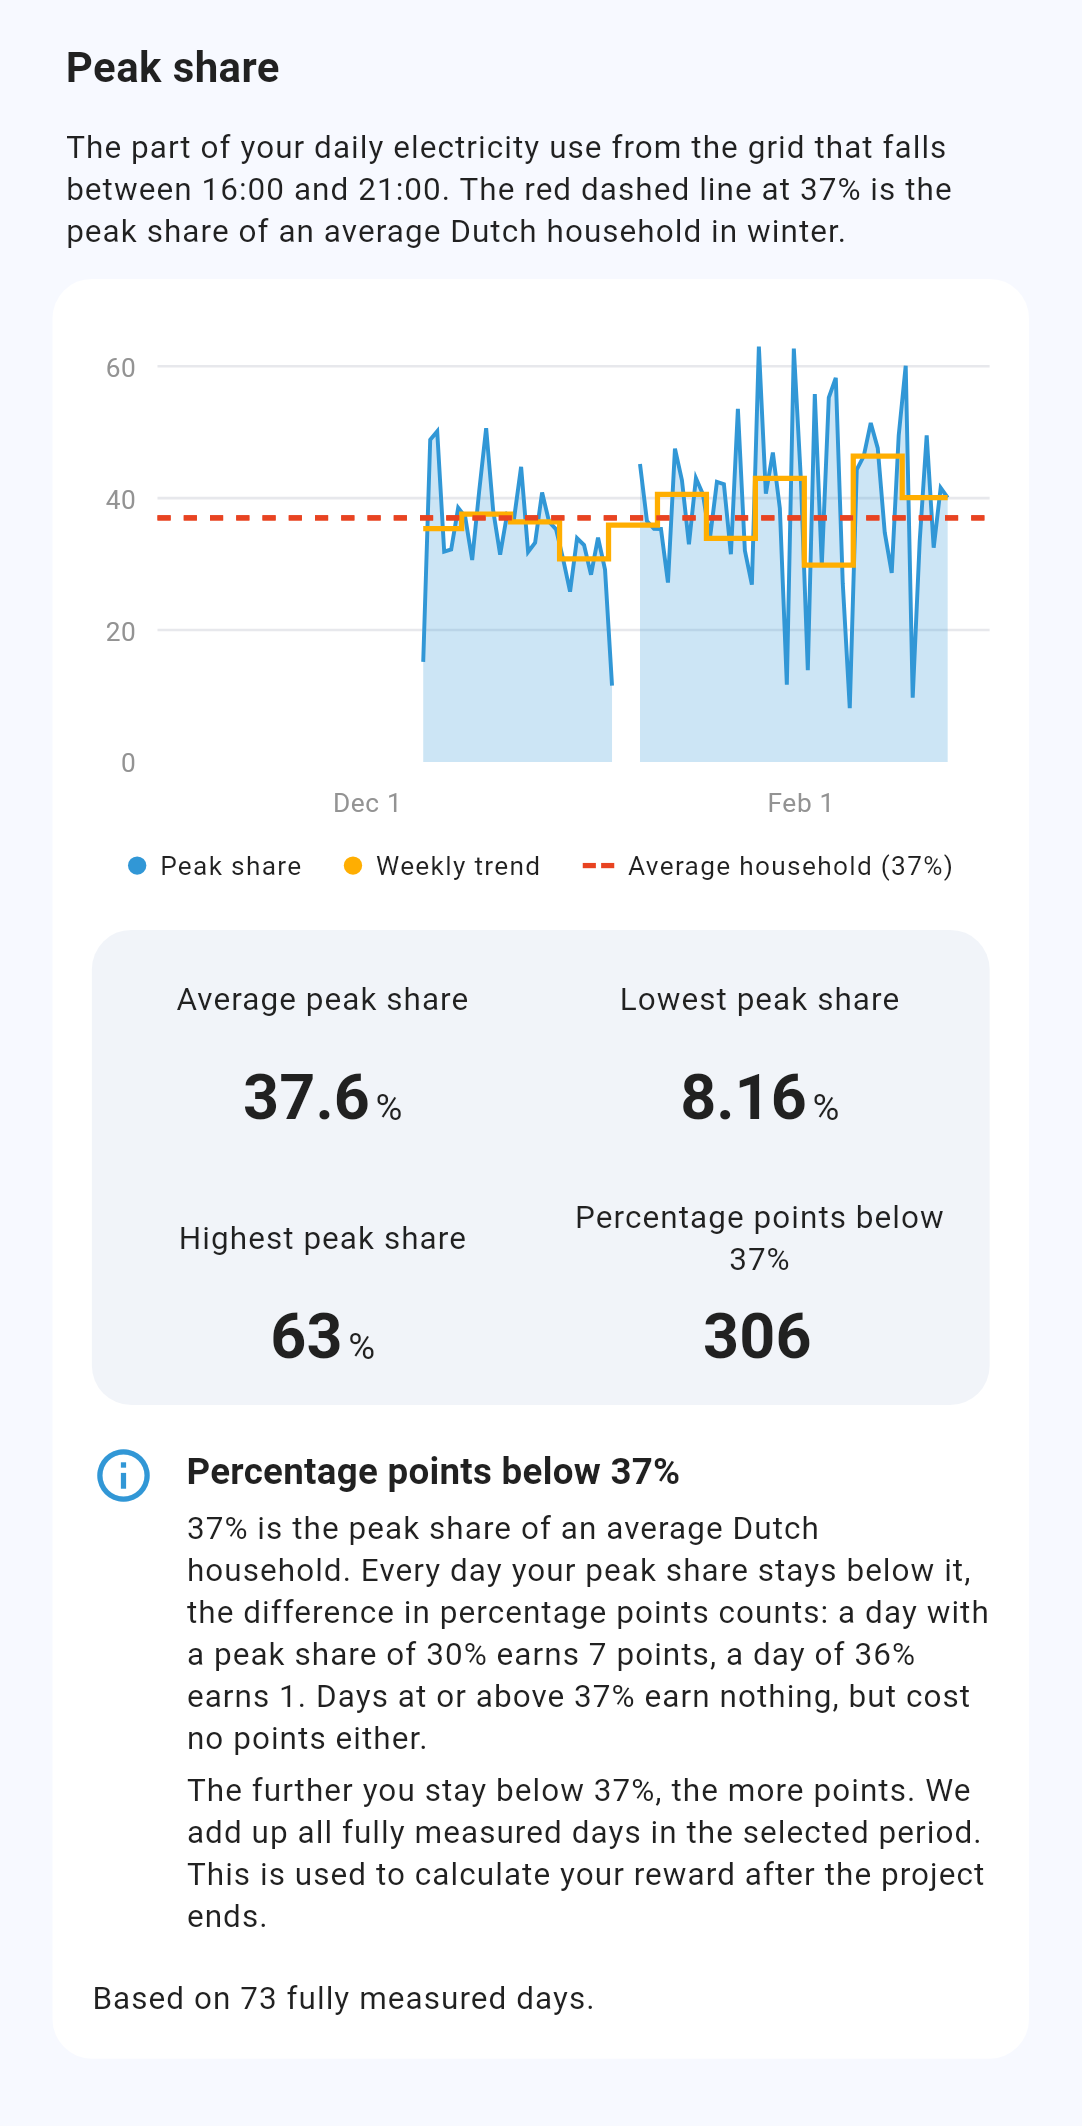
The peak share is the part of your daily electricity use from the grid that falls between 16:00 and 21:00. The red dashed line at 37% is the peak share of an average Dutch household in winter. The further you stay below that line, the better.
Percentage points
Every day your peak share stays below 37%, the difference in percentage points counts. A day with a peak share of 30% earns 7 points, a day of 36% earns 1 point. Days at or above 37% earn nothing, but cost no points either. The analysis adds up all fully measured days in the selected period. This is used to calculate your reward after the project ends.
The analysis itself gives the same explanation: click or tap the info icon next to Percentage points below 37%.
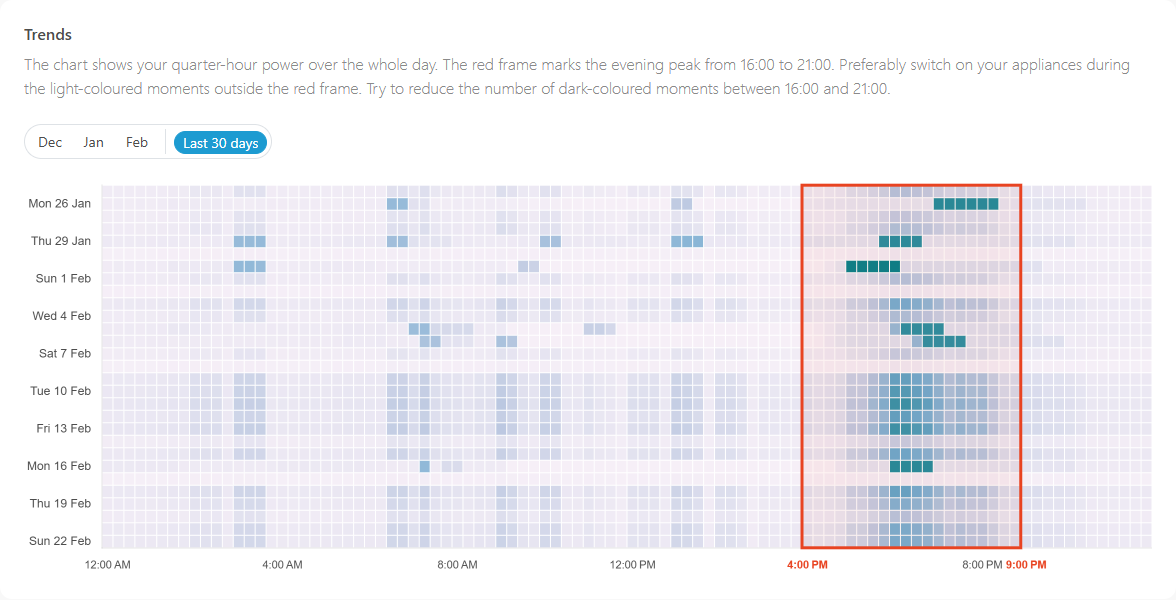
Trends
This chart shows your quarter-hour power over the whole day, with one row per day. The darker a square, the higher your consumption at that moment. The red frame marks the evening peak. Preferably switch on your appliances during the light moments outside the frame, and try to reduce the number of dark squares inside it.
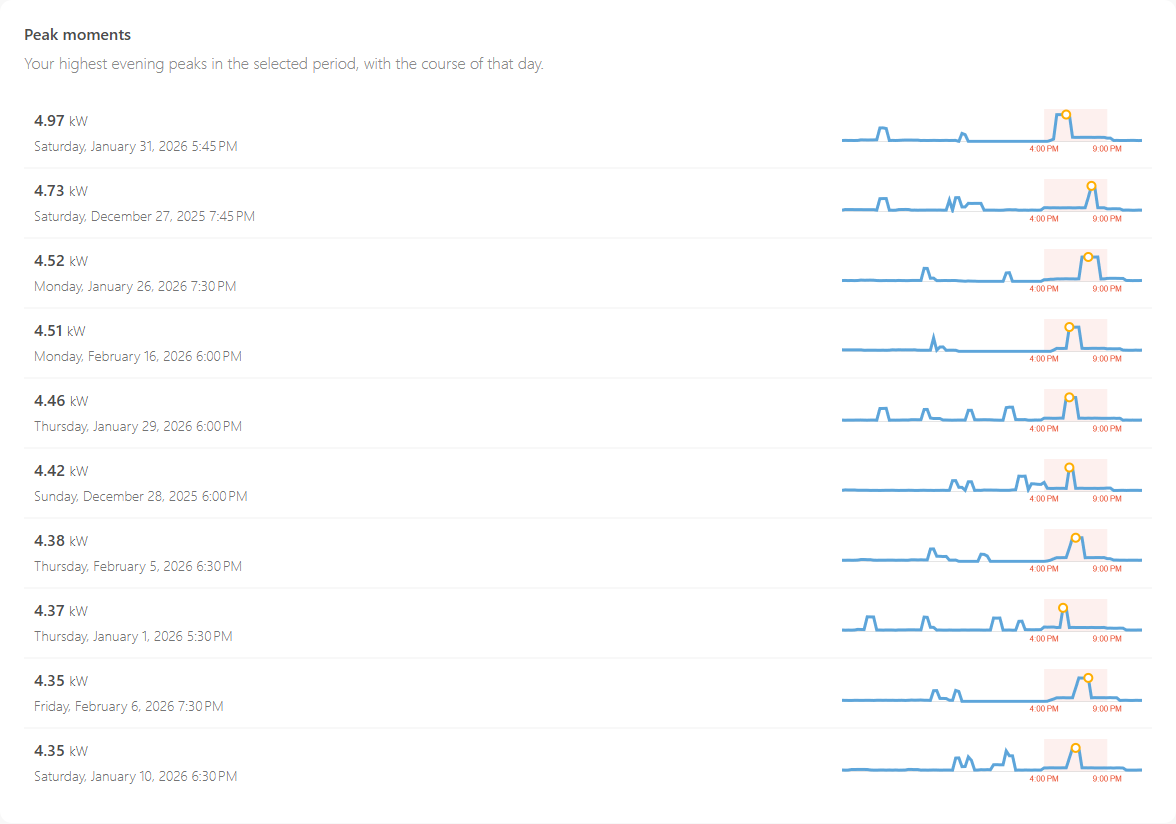
Peak moments
Here you see your highest evening peaks in the selected period, with the course of that day. This helps you recognise which appliances or habits cause your peaks.
Frequently asked questions
I don't see the analysis in my dossier. Why?
The analysis is only visible in dossiers linked to Energie van Utrecht or to a participating energy cooperative. Sign up through the project page and choose the cooperative for where you live. If you use the app, make sure you have the latest version.
Why don't I see any data?
The analysis needs quarter-hour data from your smart meter. Check that your smart meter is linked and that data is coming in. After linking, it takes about a day before the first data is there.
Why are the figures different from what I expected?
The analysis only counts days that are fully measured. If quarter-hour values are missing for a day, that day does not count towards your peak share and your percentage points. Click Refresh report at the bottom to recalculate the analysis with the latest data.
Read more about the project on the Vermijd de piek! project page (in Dutch). Questions about the project or the reward? Email piek@energievanutrecht.nl.