Compare your consumption with your peers
Benchmarking allows you to compare your consumption with similar profiles and find out if you perform better than the average.

Available benchmarks
You can compare your data with similar profiles for the following metrics:
- Energy consumption ✔ per person ✔ per m2
- Electric energy consumption ✔ per person ✔ per m2
- Non-electric energy consumption ✔ per person ✔ per m2
- CO2 emissions from energy consumption ✔ per person ✔ per m2
- CO2 emissions from electrical energy use ✔ per person ✔ per m2
- CO2 emissions from non-electric energy consumption ✔ per person ✔ per m2
- Drinking water consumption ✔ per person
Important
Not all benchmarks are available for every type of record. We aim to offer a benchmark that is as qualitative as possible. That is why benchmarks are currently only available for dwellings and schools.
Enabling benchmarking
To benchmark your consumption, you need to meet two requirements.
- You have to share your own data anonymously.
- You have to fill in the number of persons and the usable floor area. This is done at the level of your record.
As such, to enable benchmarking you have to 'share your data anonymously with EnergyID and others'. Once you have enabled this option, your data will be included in a peer group. The data you share is anonymous.
- Click on your profile icon and select Settings from the drop-down menu.
- In the Sharing data section, tick the Benchmarking checkbox.
- Click the Save button.
Change the view of the graph
The renewed benchmarks allow you to quickly and efficiently compare your consumption with others. Even though the standard colour bar shows you at a glance whether you are energy-efficient or not, you can change the view of the graph.
-
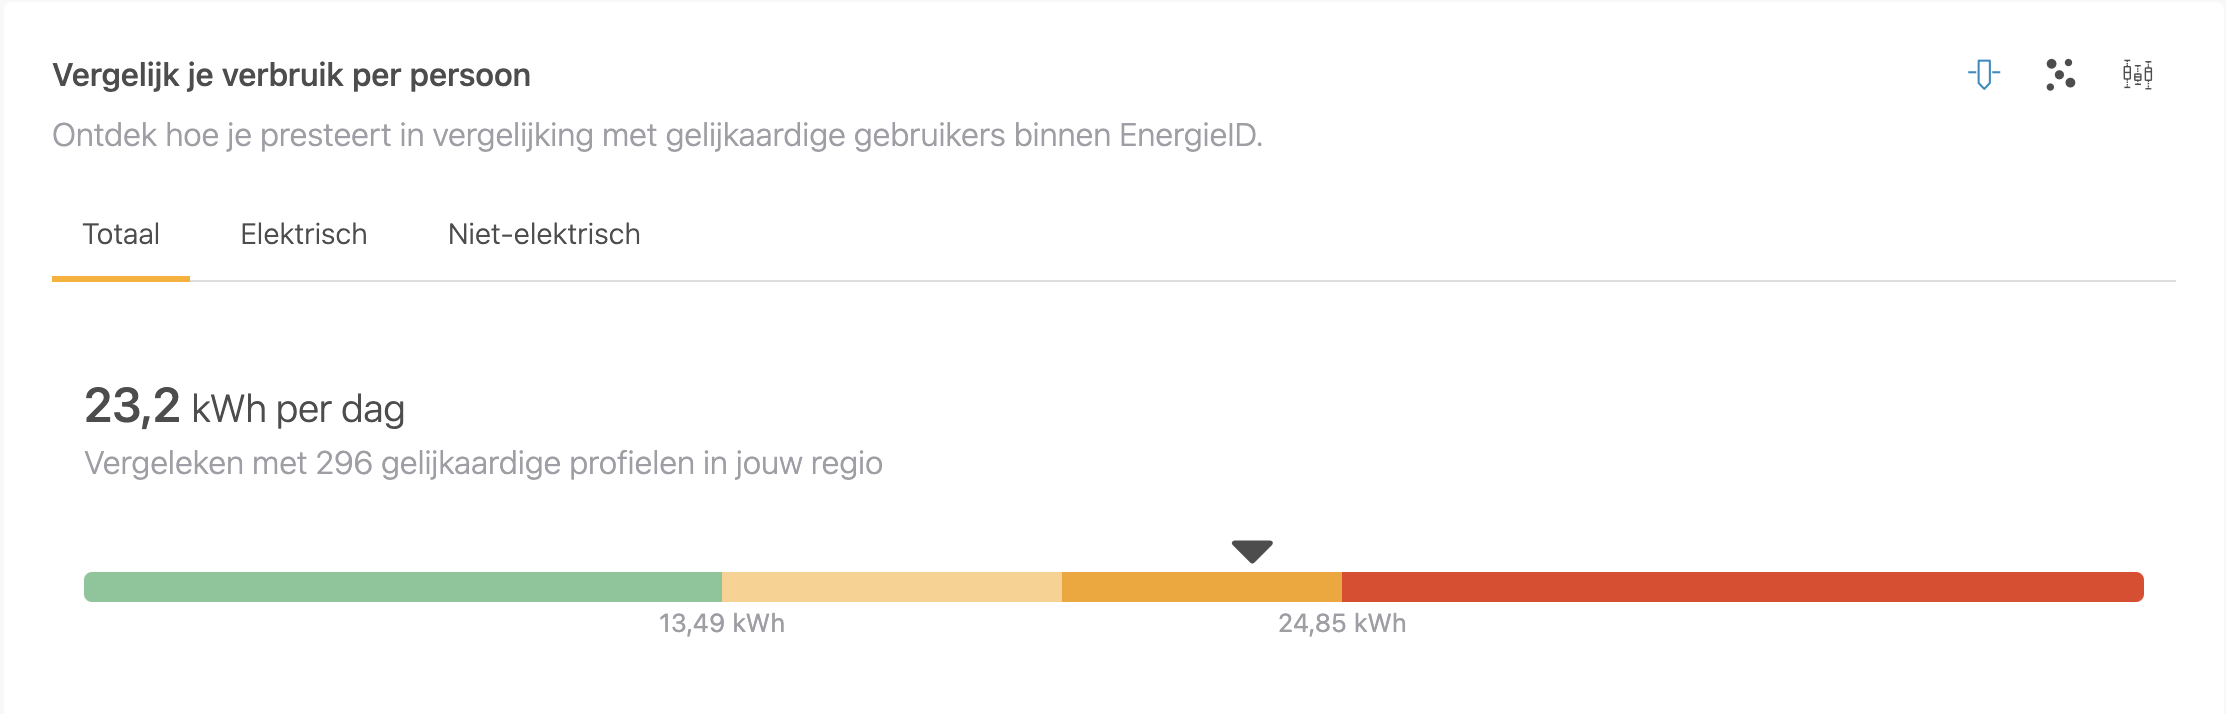
Colour bar
This is the default view for benchmarks. A simple colour bar shows at a glance whether your consumption is low (green), moderate (yellow), high (orange) or very high (red).
-
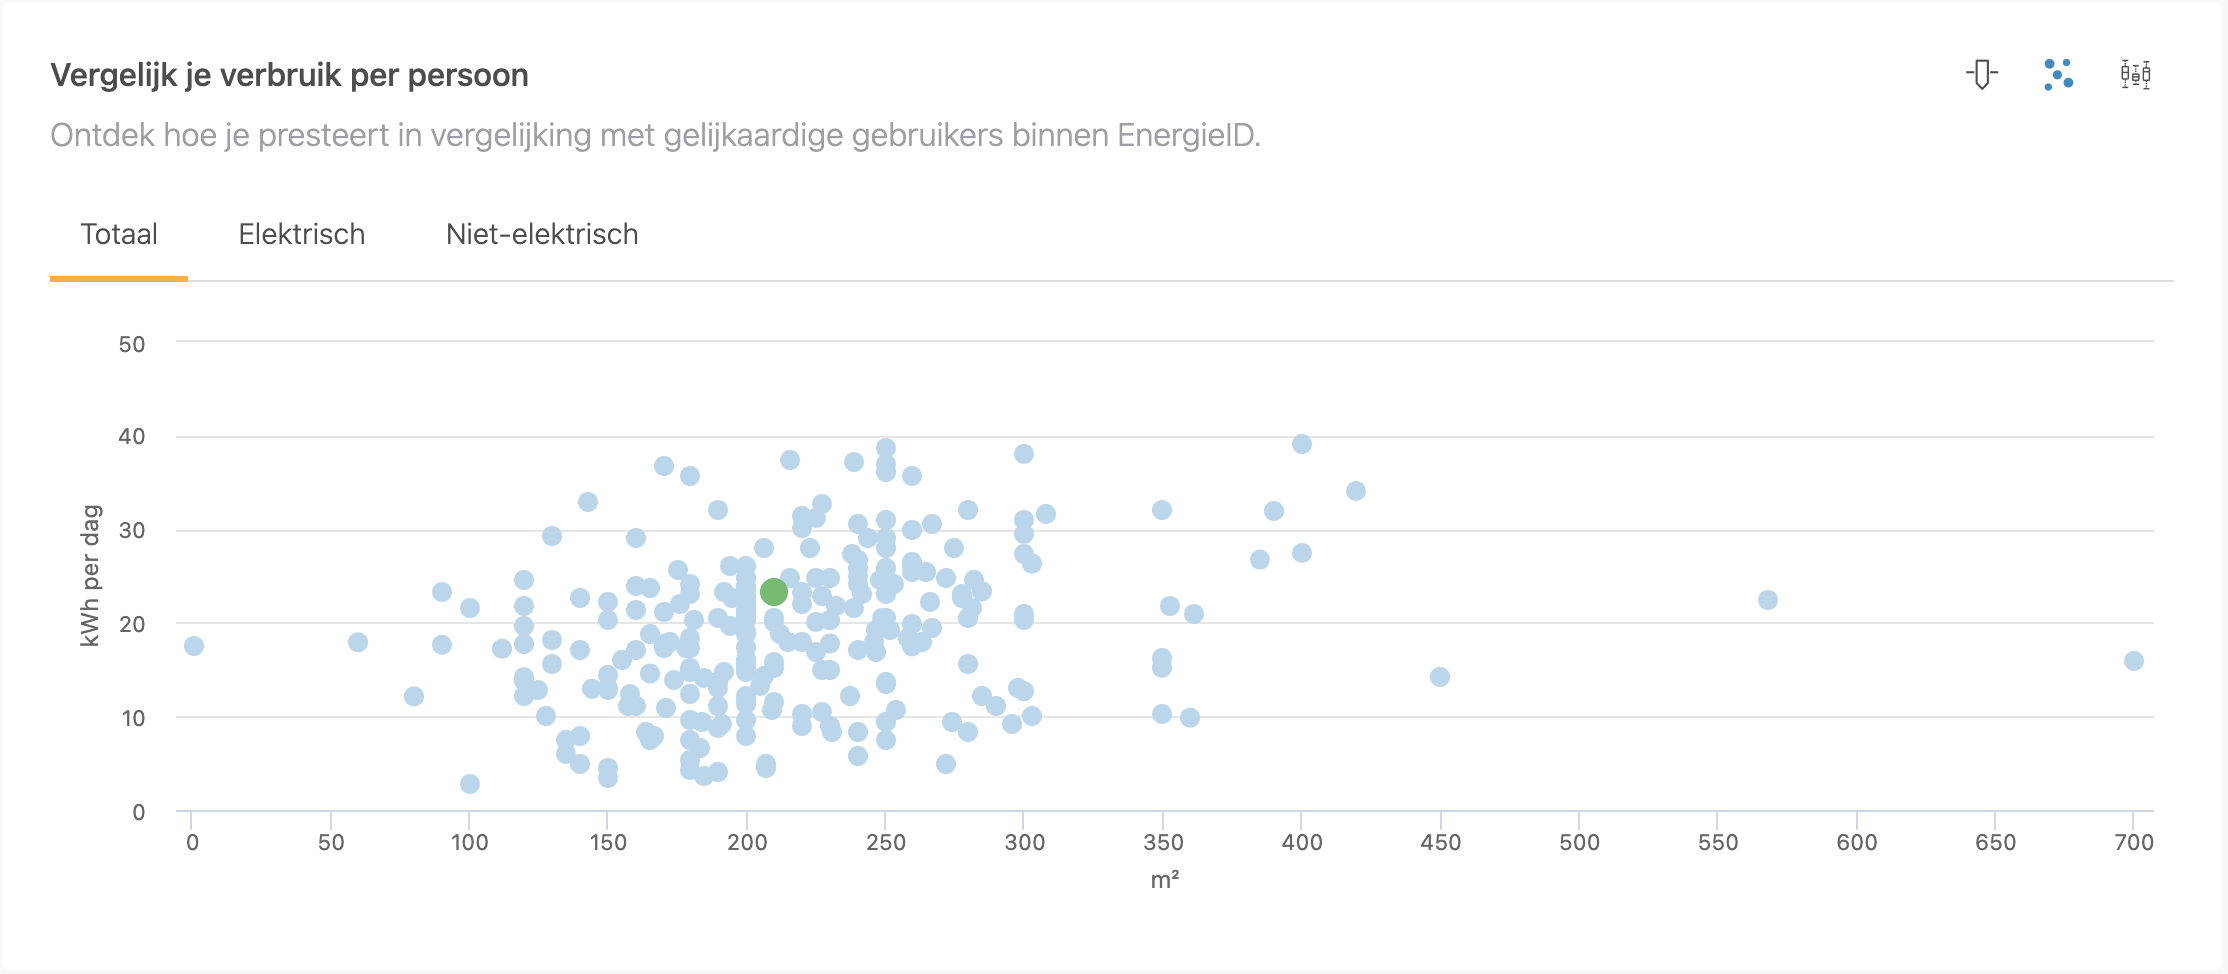
Point cloud
The point cloud gives an overview of the data points that are included in your benchmark group. Your own point is highlighted in green in the graph.
-
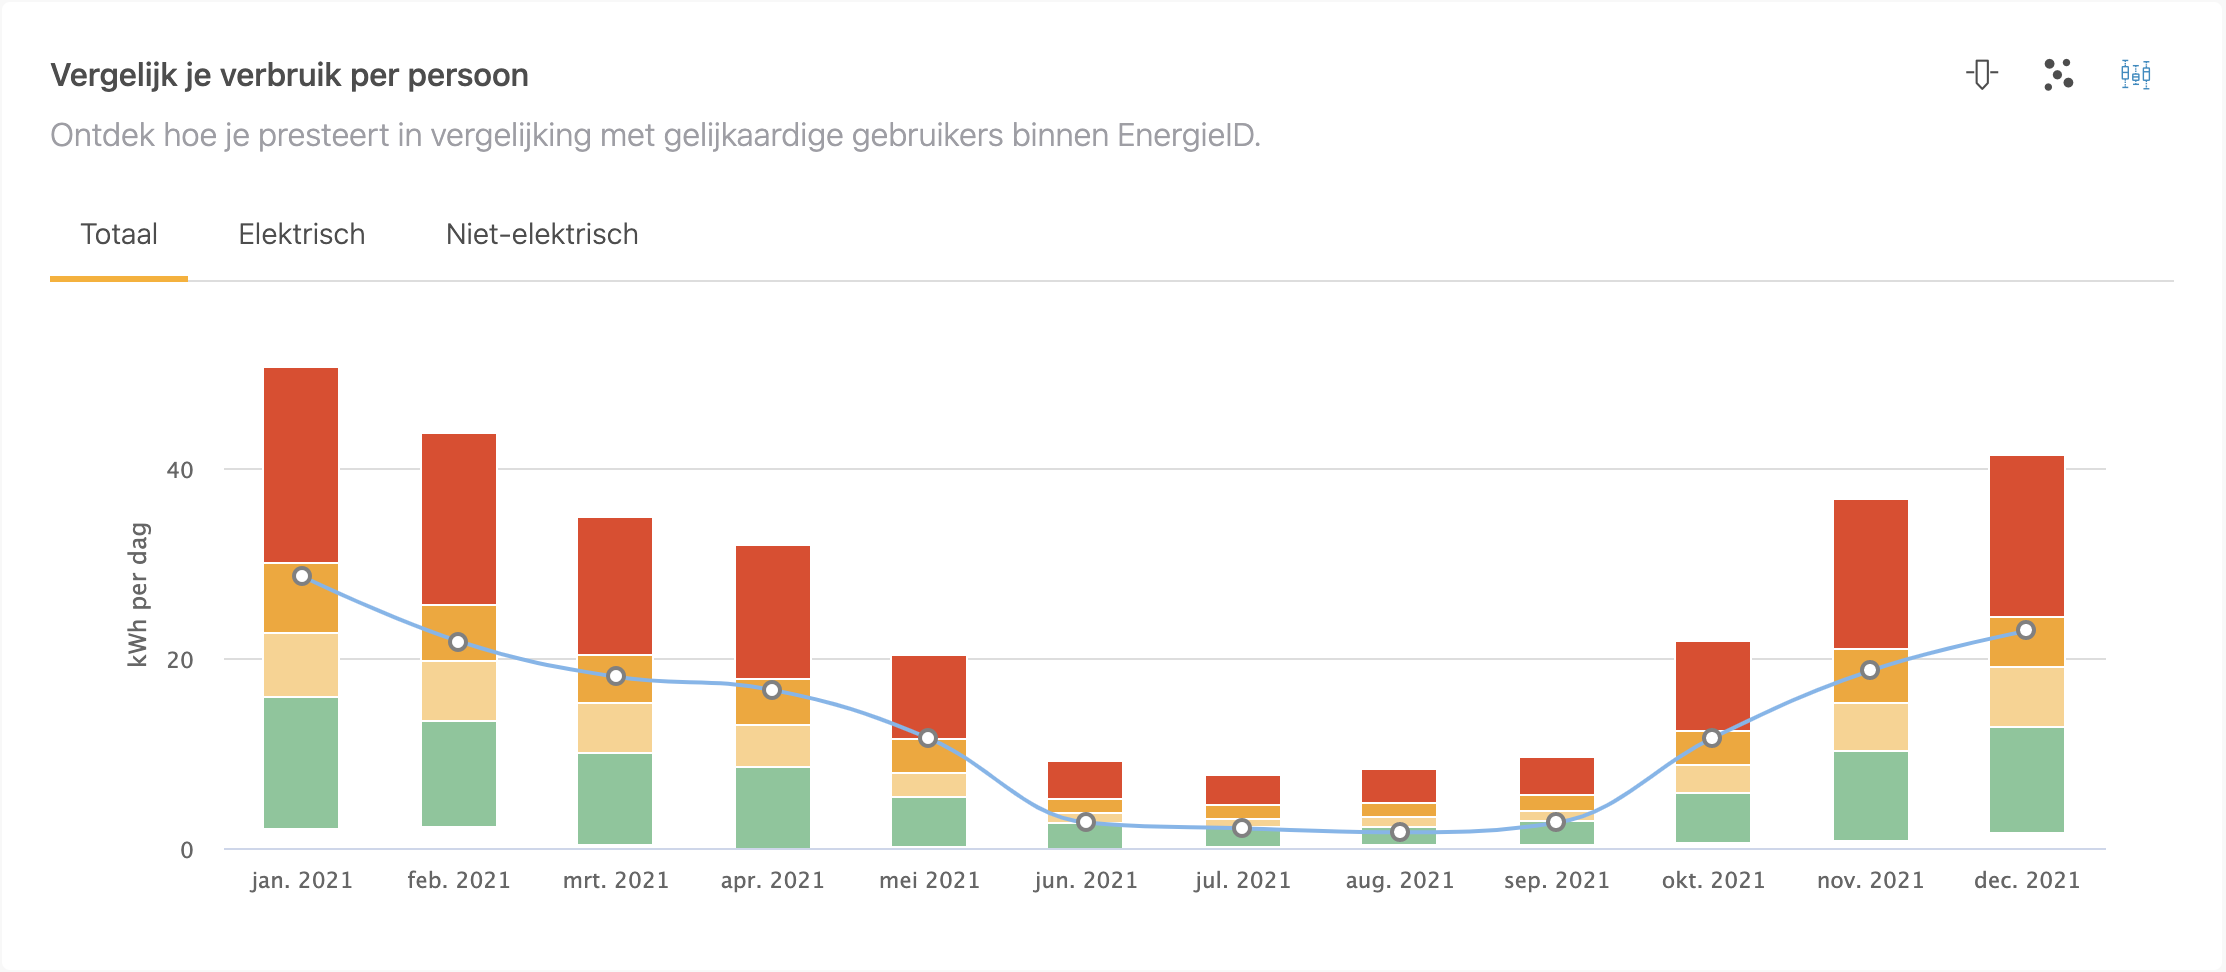
Monthly evolution
This graph shows the evolution of your monthly benchmark score.
Peer benchmark groups
EnergyID provides benchmarking data to help you better understand the energy performance of your household, home or building. This data is created from peer groups, groups of similar households or buildings. Peer groups are used in many reports.
Peer groups are explicitly created to provide useful and actionable comparisons, but they are also designed to protect user data and prevent other users from accessing your sensitive metering data.
What you should know about peer groups in EnergyID:
- All data is subjected to intensive quality control, which ensures that incomplete, incorrect or duplicate measurements are excluded from the population analysis.
- All consumption data in your region is classified according to the number of persons / family size and the usable floor area. This means that you always compare your consumption with peers who have a similar number of persons or a similar floor space.
- For electrical and non-electrical energy consumption, we define peer groups based on the end-use of electricity (heating, domestic hot water, cooking, lighting & appliances). This means that you always compare your electrical and non-electrical consumption with peers who have a similar end-use of electricity.
- Any outliers are removed from the results.
- In order to protect the anonymity of the users and to prevent the data from one record from being identifiable, at least 50 records are required.