Capacity analysis
☑ EnergyID Premium ☑ Flanders, Belgium
Starting in 2023, the network charges on your electricity bill depend not only on the amount of electricity you consume but also on how much you strain the electricity grid. Simultaneously running electrical appliances like a washing machine, electric stove, heat pump, charging station, and similar devices strain the grid more. Spreading out your consumption is the key! We have provided some handy summaries to assist you with this.
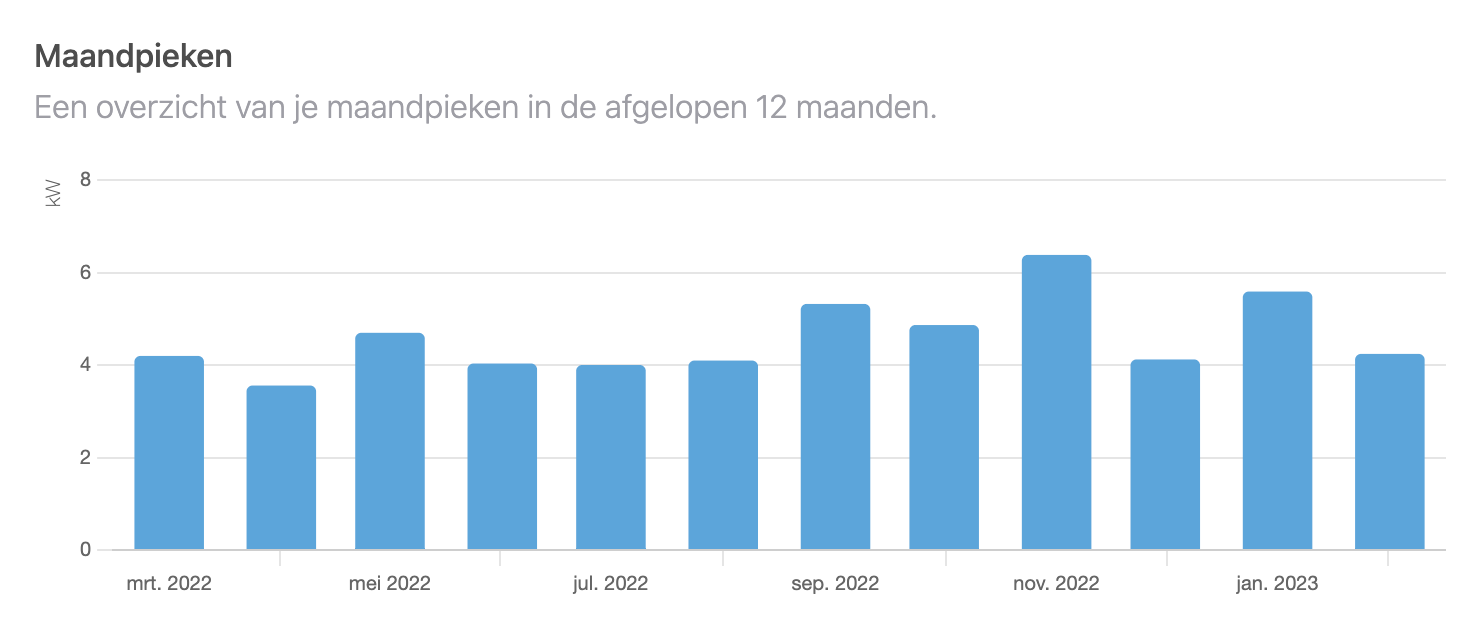
Understanding your monthly peak power
With a simple chart, you'll see the current month's peak and the previous 11 months' peaks. These determine your average monthly peak that counts for your network charges. The lower, the cheaper.
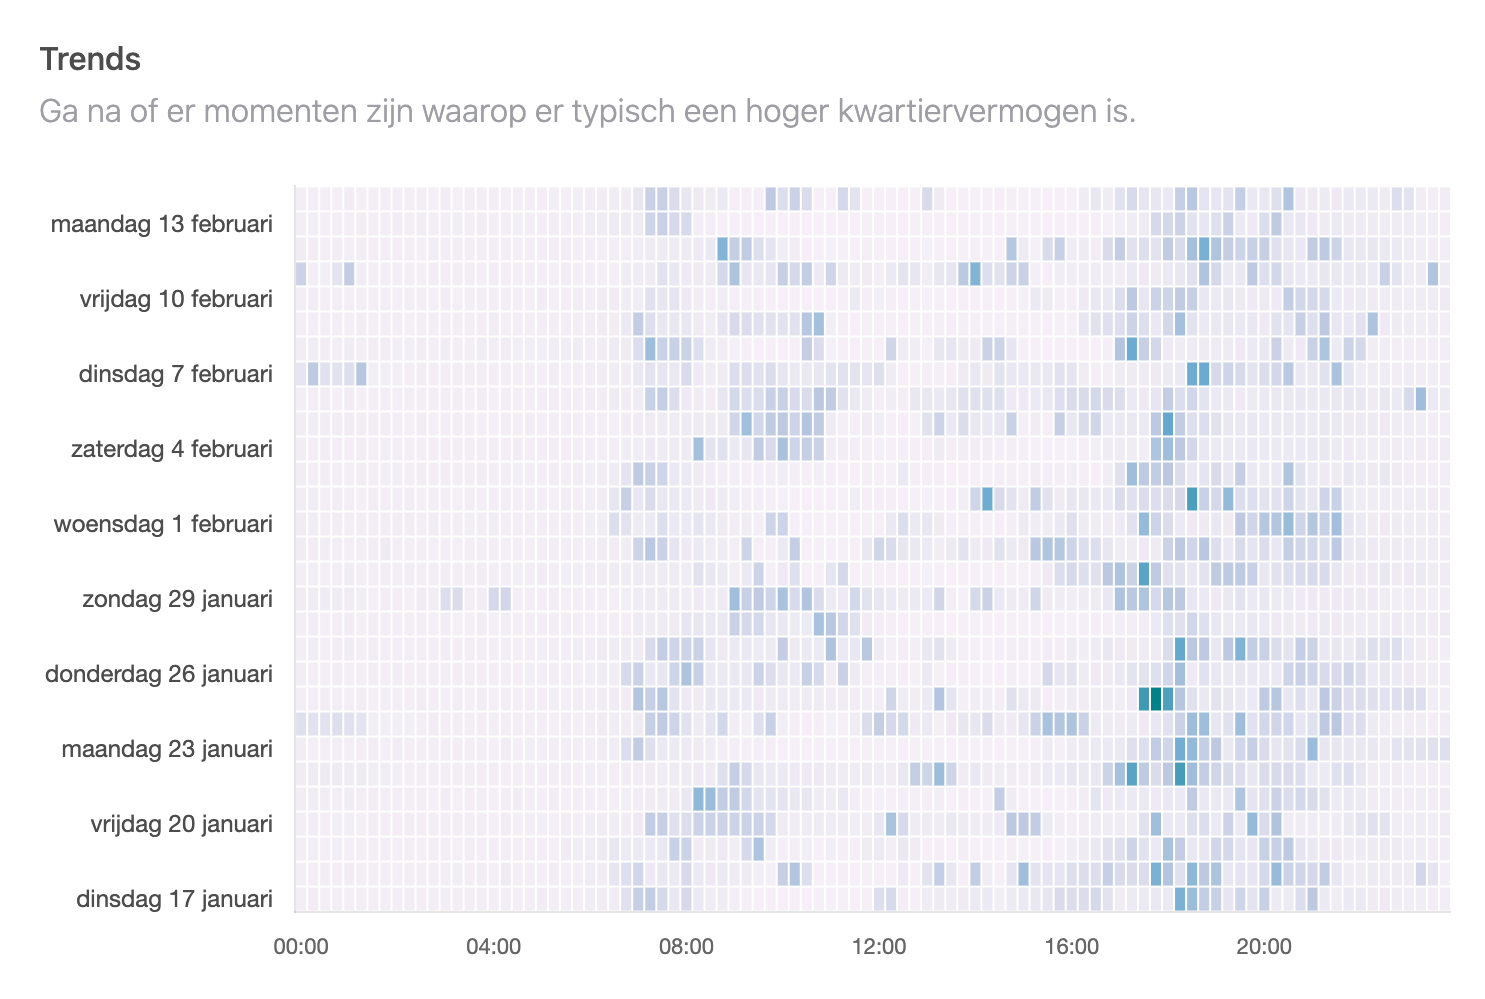
Trends make it even more understandable
We provide a great way to quickly comprehend past peaks. We display 30 days in detail. Each line represents a day from left 12:00 AM to right 11:45 PM. The darker the color, the higher the peak. Convenient, isn't it? Hover over the box to see more details.
This feature is only available in Premium HR (high-resolution) records.
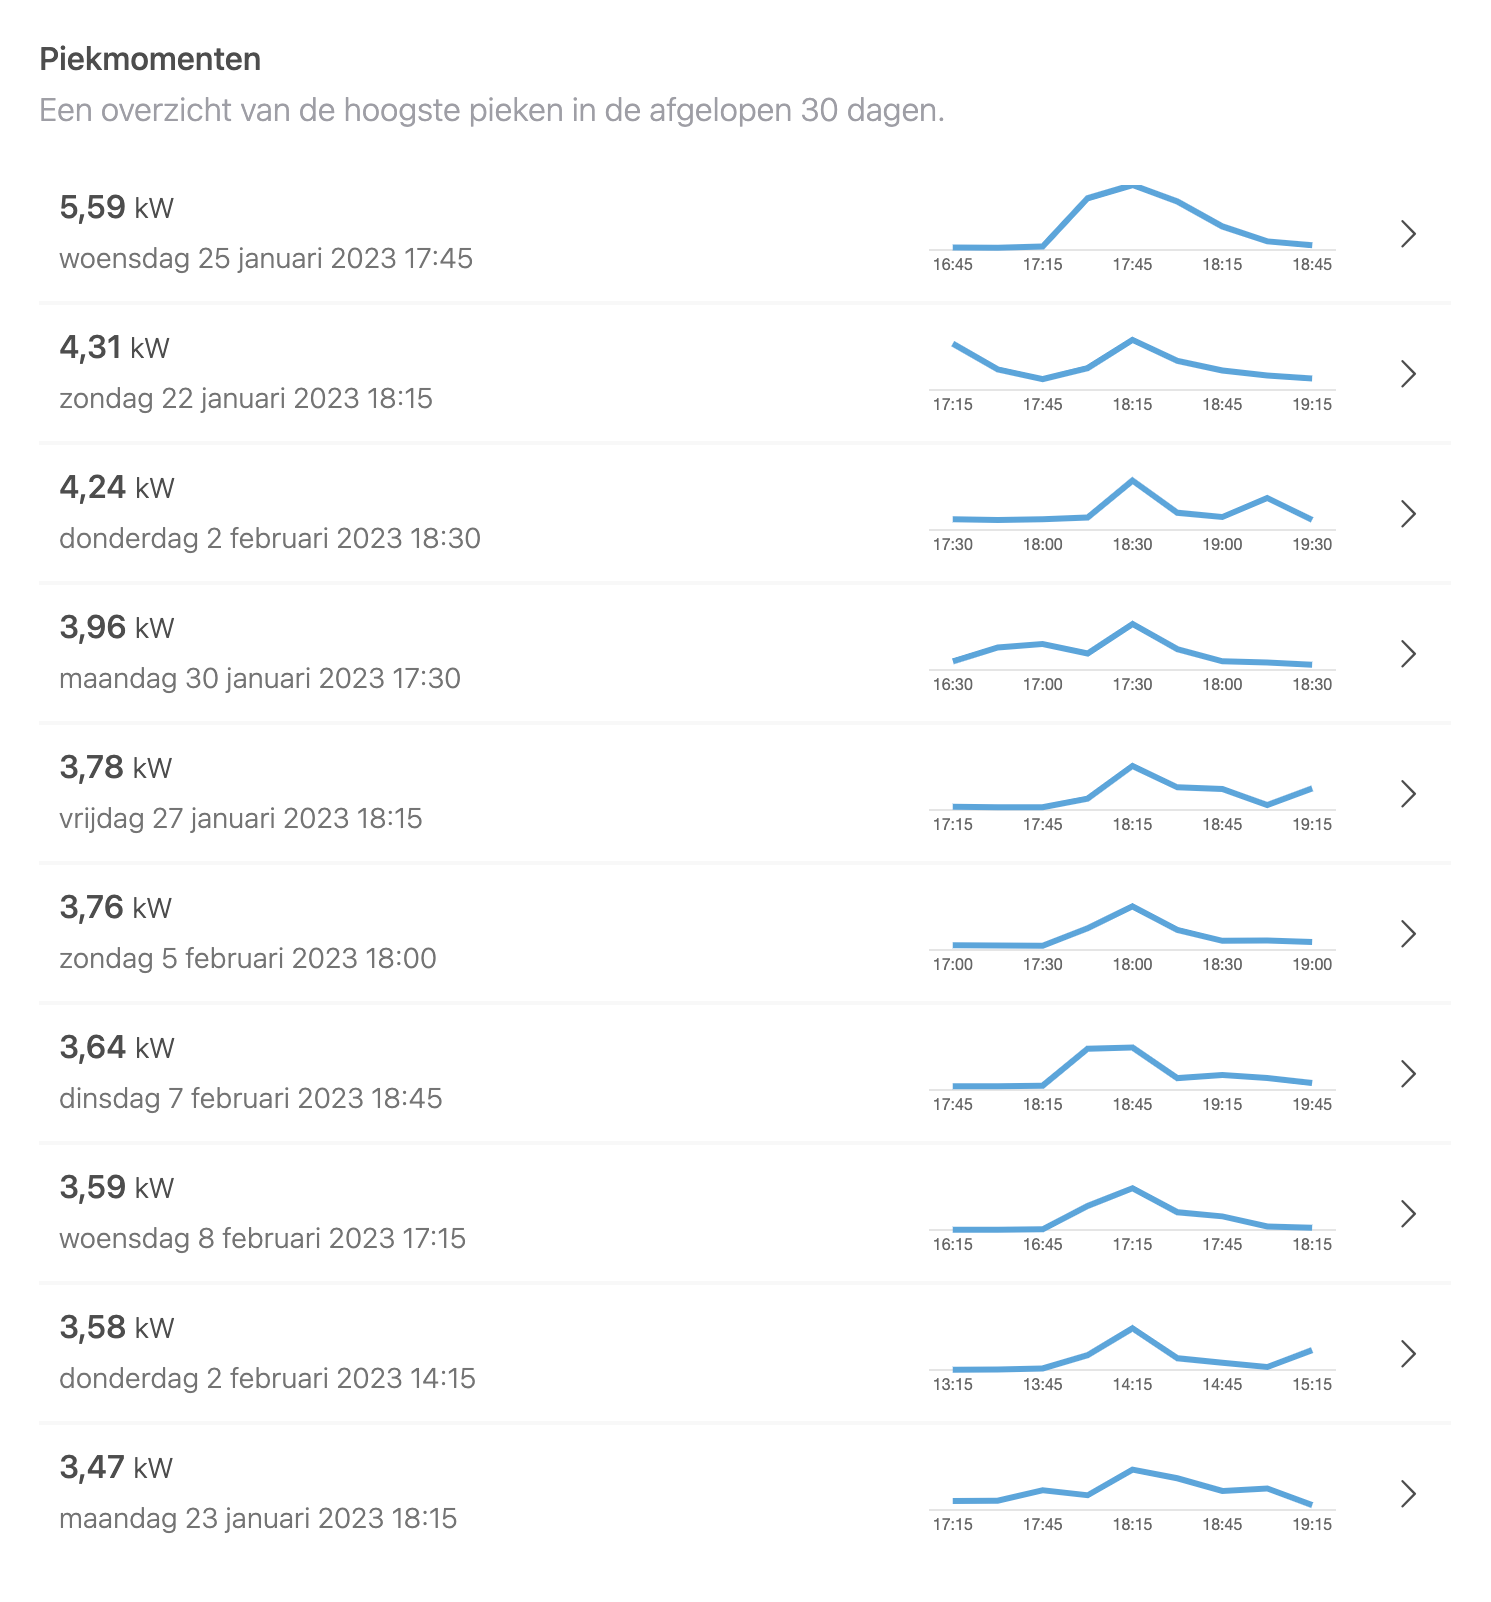
Your personal top ten peaks
If the above graph seems a bit challenging, we offer a quick overview of the 10 highest peaks in the last thirty days. Click on a line to view that day in detail.
This feature is only available in Premium HR (high-resolution) records.
How do I activate this analysis?
- For this analysis, you need an active Premium or Premium HR subscription.
- For this analysis, you need an electricity meter that measures at high resolution (at least 15 minutes) and supports power measurements. Currently, this is only the digital meter via the Fluvius integration. Normally, the creation of the two power meters (consumption/injection) happens automatically (if Premium or Premium HR). If that is not the case, you can manually add them via the Fluvius integration.