Energy consumption
This comprehensive report provides an overview of your energy consumption and the achieved savings resulting from changes in behaviour and improved efficiency.
Essentially, this report provides insight into four key areas:
- Evolution of your consumption + verification
How much electricity, gas, heat, fuel oil, or biomass have you consumed? And how does it compare to the previous year? - Energy balance
An overview of delivered, produced, and exported energy. Which energy vector (electricity, natural gas, fuel oil, etc.) has the largest share in your total consumption and therefore offers the most significant potential for savings? - Consumption per person (benchmark)
What is the consumption per person, and how does it compare to others? - Consumption per energy flow
How do different energy flow compare to the total?
Monitor your consumption and savings
You can monitor both your consumption and potential savings using a simple graph.
What do you need?
- Recent meter readings, one meter reading per month is sufficient.
- Historical meter readings, preferably from the 12 months preceding the reporting period. Tip: You can find your old meter readings on your energy supplier's annual invoice.
If you don't have enough historical meter readings, unfortunately, your savings cannot be calculated. But don't worry, by regularly entering meter readings or connecting an automatic data source, your record will stay updated. This way, you'll be able to use our M&V (Measurement and Verification) services in the future.
MEASUREMENT & VERIFICATION (M&V)
Our M&V services are based on the International Performance Measurement and Verification Protocol (IPMVP), an international standard for quantifying realized energy savings. Together with ISO-52000 standards, this methodology forms the basis for monitoring your energy efficiency and reporting savings.
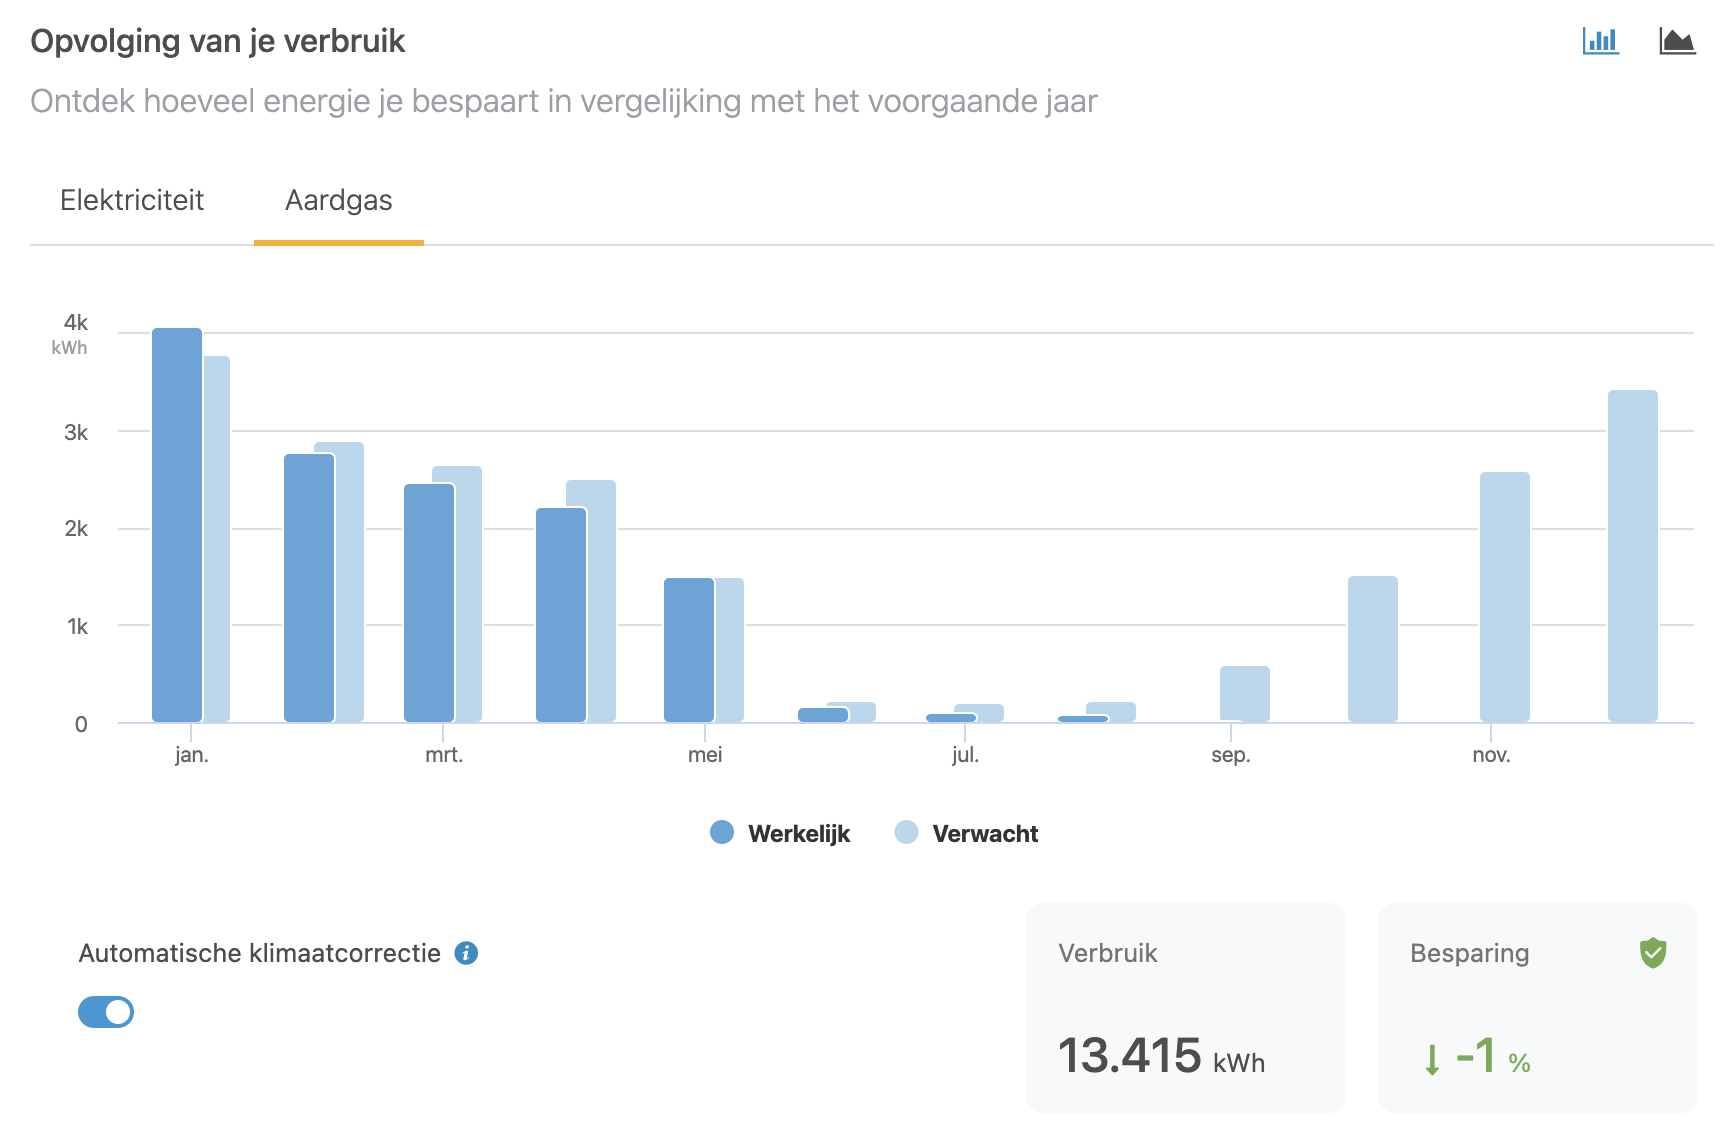
Automatic climate correction
To calculate your savings, we first estimate the consumption for a specific month. By default, we base this on the consumption in the previous calendar year. This is referred to as your reference consumption.
If there's a correlation between your reference consumption and weather conditions, such as outdoor temperature, this consumption is automatically adjusted. This allows us to compare consumption in a harsh winter with that in a mild winter.
The difference between the estimated and actual consumption shows the deviation from the consumption pattern of the previous period. If this difference is negative, it indicates savings, and positive values indicate an increase in consumption.
You can disable climate correction if you want to see the deviation from the actual reference consumption. To do this, disable the Automatic climate correction option at the bottom of the graph.
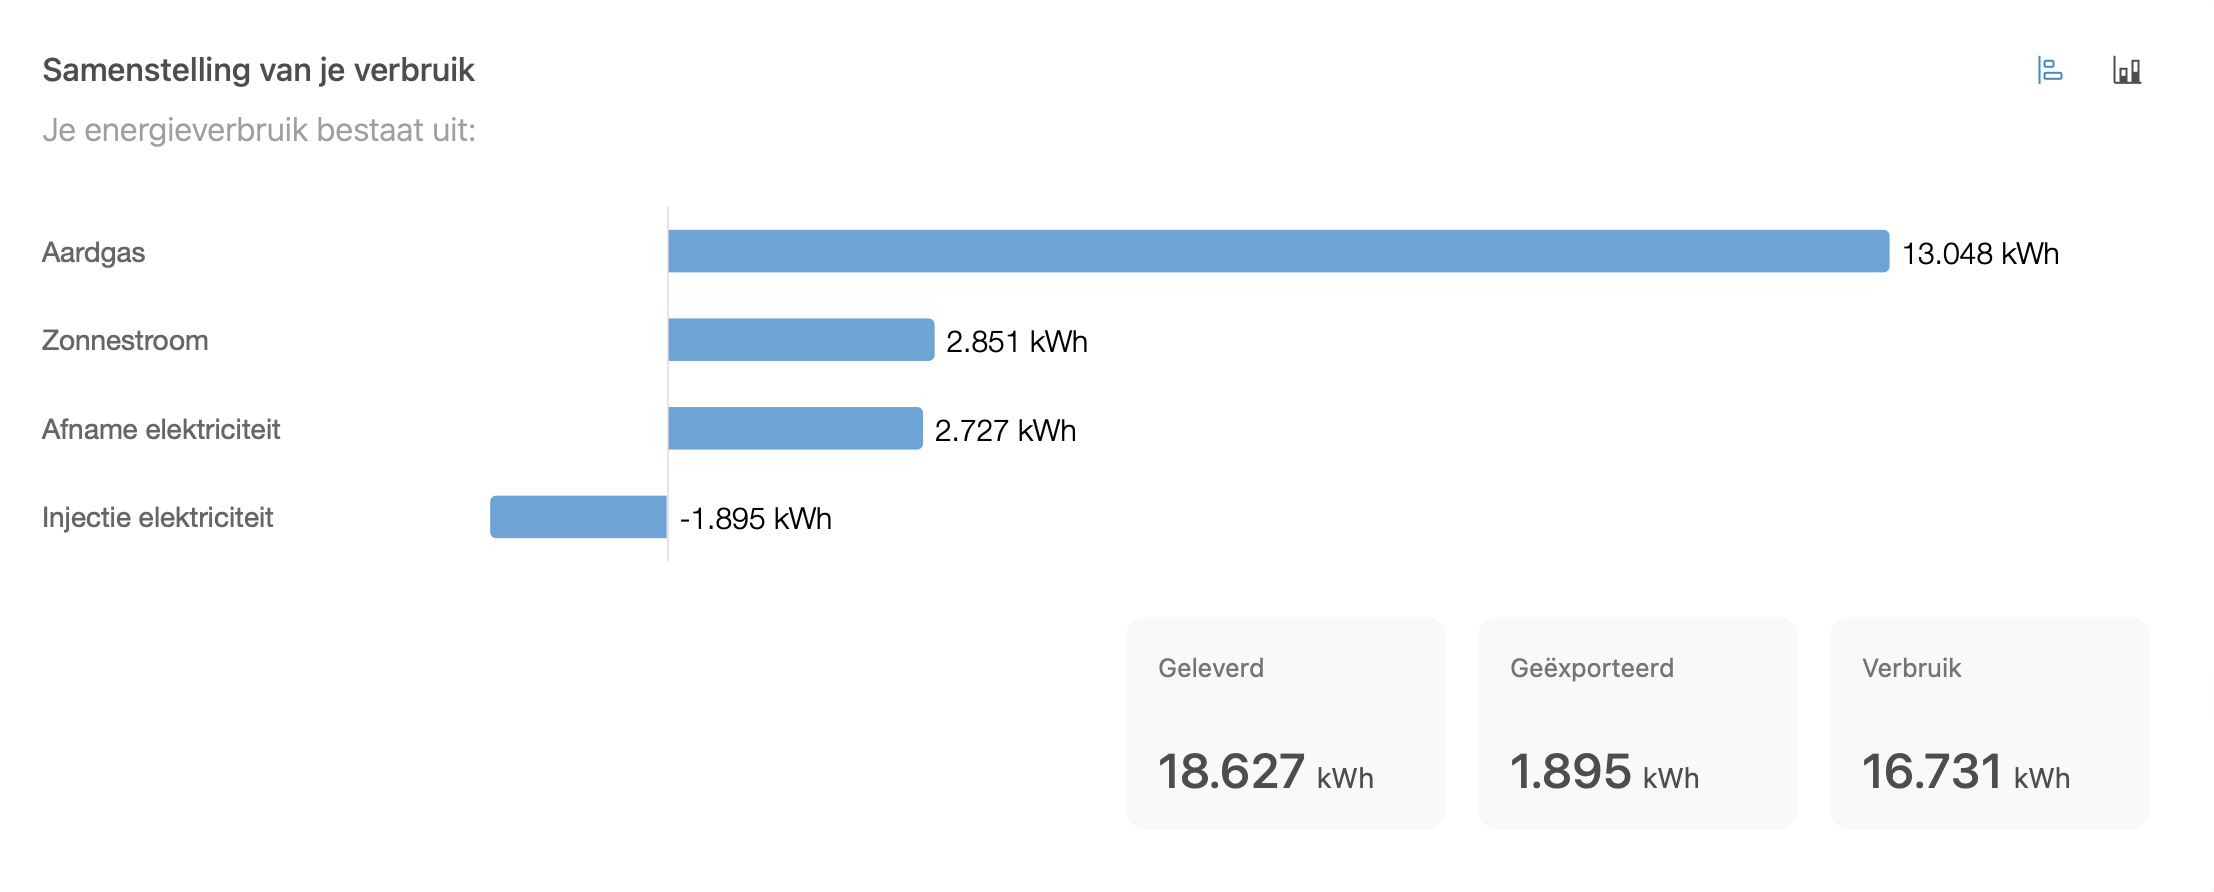
Energy balance
The energy balance provides insight into the composition of your energy consumption. It reveals which energy vector has the largest share in your total consumption and therefore the greatest potential for savings.
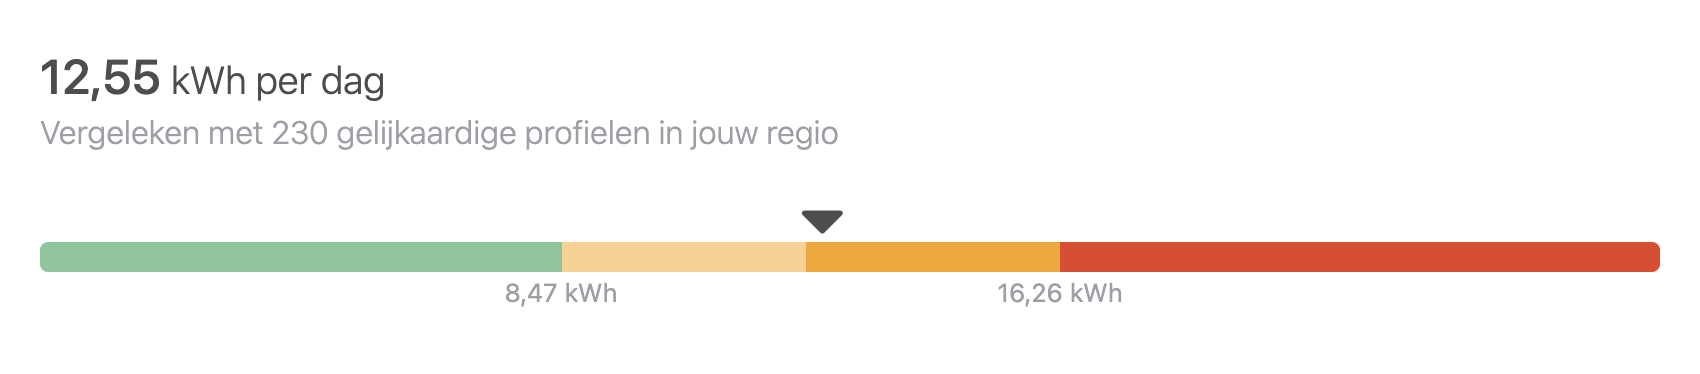
Compare your consumption
Curious how your consumption compares to similar profiles?