Analyse your baseload
✓ EnergyID PremiumSome appliances always use electricity, even when nobody is home or everyone is asleep: the fridge, the freezer, the router, devices on standby, the heating pump or the ventilation. That continuous consumption is your baseload. The baseload analysis gives you insight into that consumption.
Available for Premium records. Read how to activate EnergyID Premium.
Where do you find the analysis?
- Open your record.
- Go to Analyses.
- Choose Baseload analysis.
What do you need?
The analysis works on an electricity grid connection of your record, with:
- an offtake meter linked to that grid connection;
- with quarter-hourly or hourly values, for example from your digital meter.
Do you also measure the production of your solar panels and your feed-in? Then the analysis is more accurate (see below).
What do you see in the baseload analysis?
Baseload
The chart shows how much power your appliances need continuously, expressed in watts (W). You see how your baseload evolves and how it varies throughout the year.
We automatically filter out short peaks, so that a single outlier does not distort the result. The Monthly median line shows the typical baseload per month.
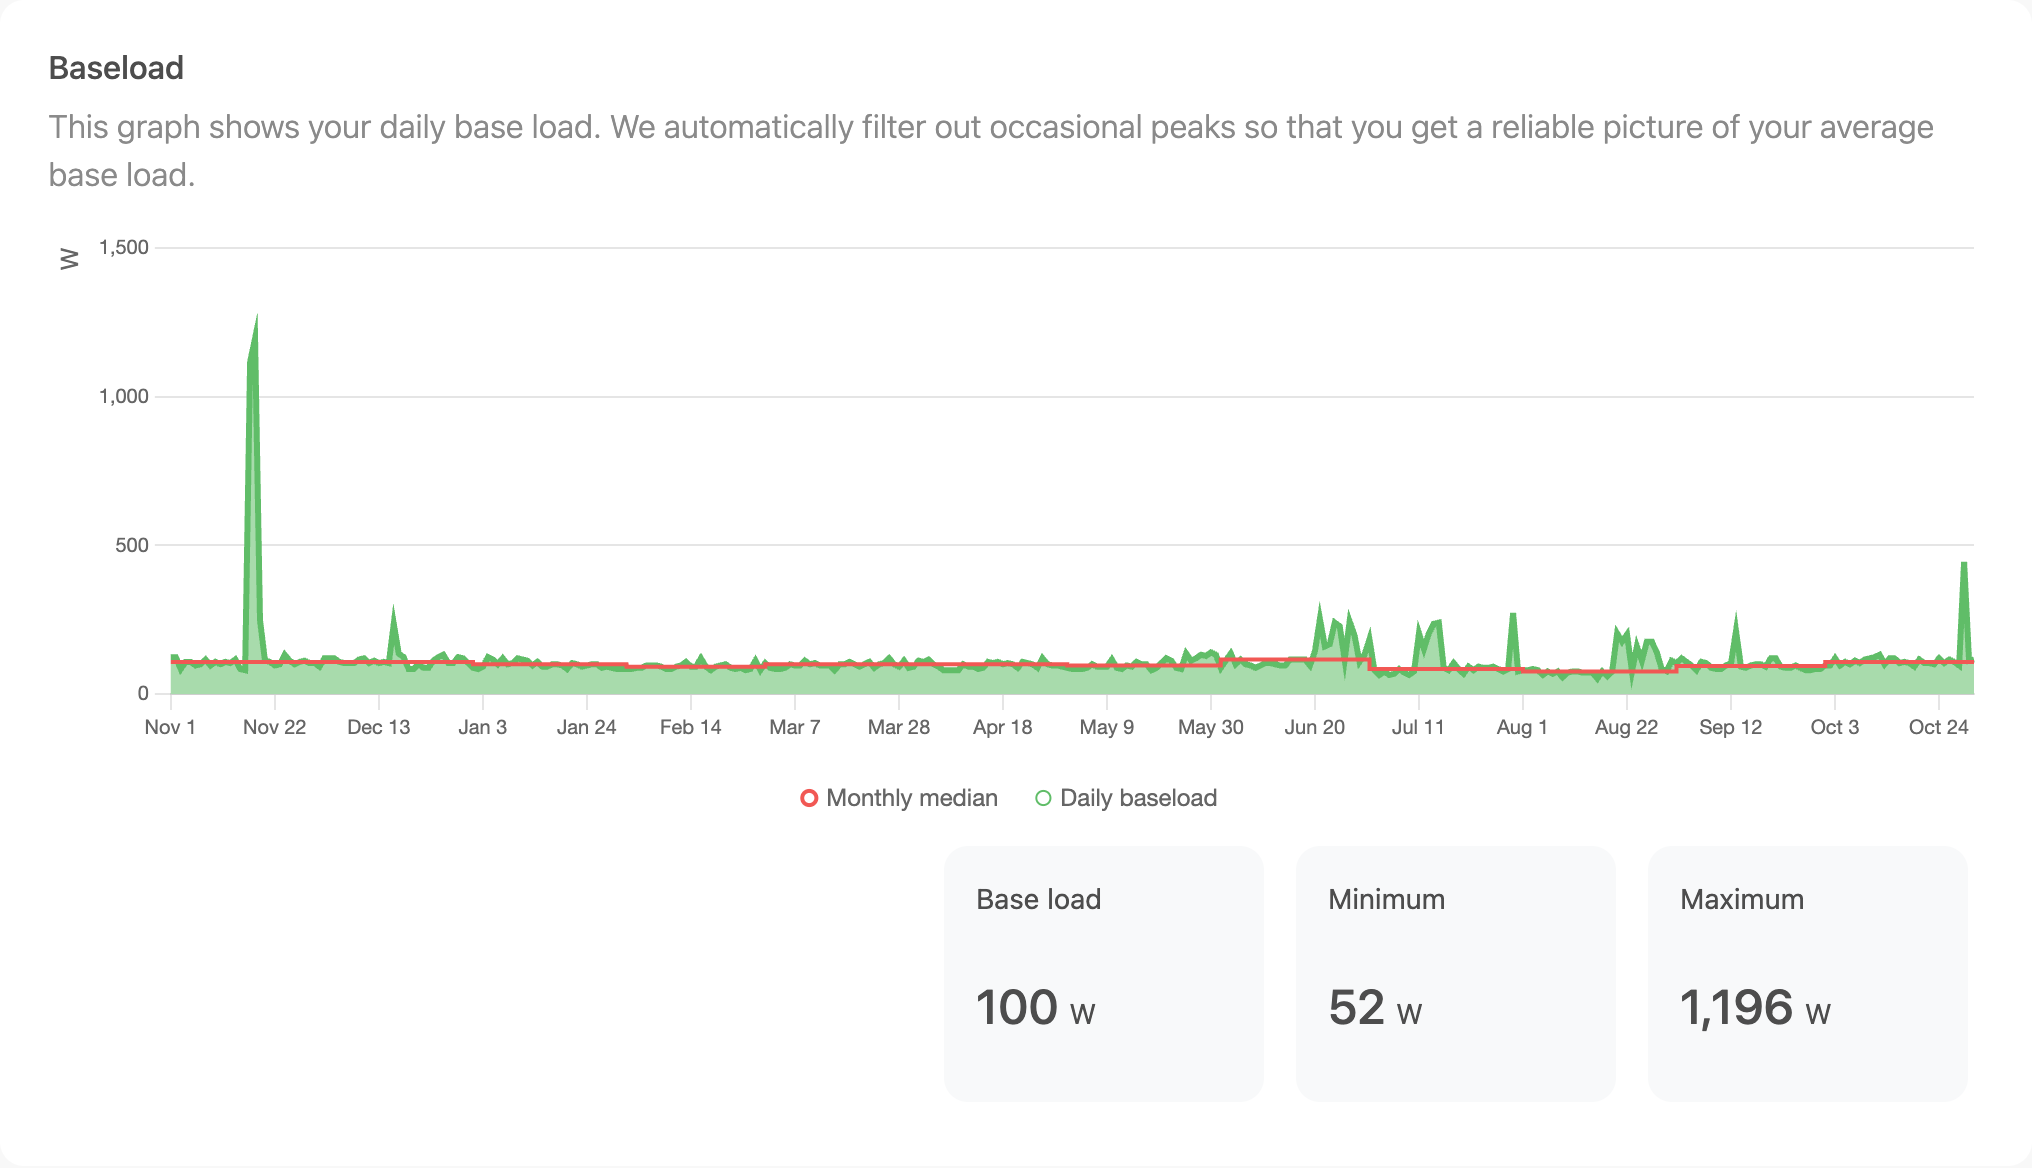
Below the chart are three key figures:
- Base load: your typical baseload over the selected period;
- Minimum: the lowest daily baseload;
- Maximum: the highest daily baseload.
Is the baseload clearly higher in some months? Then an appliance is probably running continuously during that period, such as the circulation pump of your heating in winter, or a pond pump, dehumidifier or air conditioning in summer.
Baseload consumption
The chart shows how much electricity your baseload represents, expressed in kilowatt-hours (kWh). You see which share of your total electricity consumption goes to appliances that are always on.
We calculate the baseload consumption from the monthly median baseload and the number of hours in that month. What remains of your total consumption is the other consumption, for example from cooking, washing and heating.
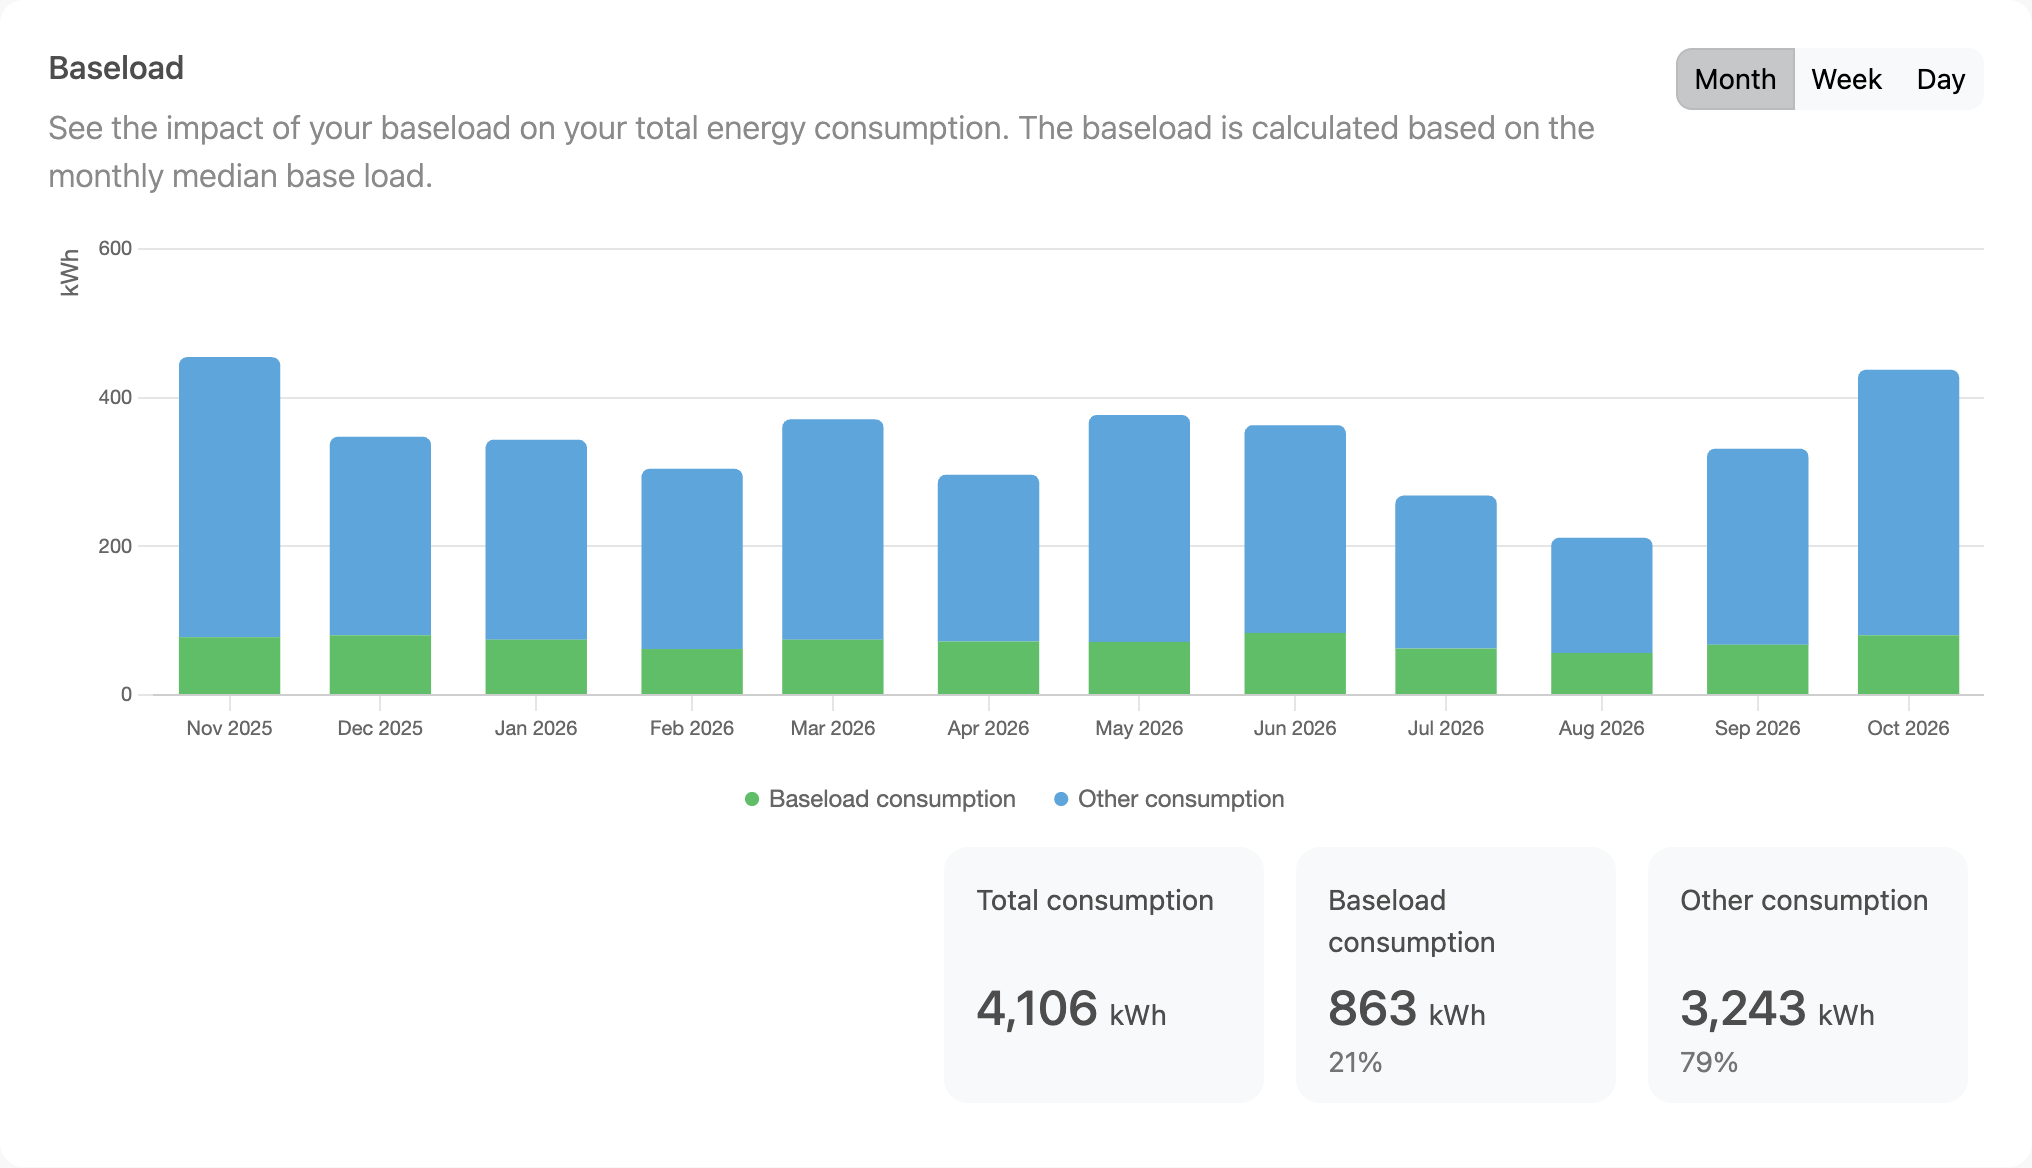
With the buttons at the top right you show the chart per day, week or month. The key figures below give the baseload consumption and the total consumption over the selected period, with the share of each.
Grid connection and period
At the top you choose the grid connection and the period for which you want to view the analysis. Does your record have several electricity grid connections? Then select the right connection here. By default, the analysis shows the last 12 months.
How do we calculate your consumption?
For this analysis we take into account your offtake from the grid, the production of your solar panels and your feed-in. This way we determine how much electricity you actually use.
Nighttime offtake. Do you have solar panels whose production is not measured separately? Then we cannot determine your actual electricity consumption during the day. That is why we calculate your baseload only from your grid offtake at night, when your solar panels produce nothing. You then see the label Nighttime offtake at the top. Add a meter for the production of your solar panels for a more accurate result.
Refresh report
At the bottom you see when the report was generated. Is new metering data available in the meantime? Then click Refresh report.